This section Contains the data-set which is required in all the chapters namely as 1. House prediction data-set 2. HR-Employee data-set 3. Student data-set
data.rar
Chapter- 1 -> Begin with Basics
Welcome! Folks to Become a Data AnalystCourse.
You will Learn python basics via Jupyter Notebook, So Let's Get started.
What is Python ?
Python is a high-level, interpreted, interactive and object-oriented scripting language. Python is designed to be highly readable. It uses English keywords frequently where as other languages use punctuation, and it has fewer syntactical constructions than other languages.
Python is Interpreted − Python is processed at runtime by the interpreter. You do not need to compile your program before executing it. This is similar to PERL and PHP.
Python is Interactive − You can actually sit at a Python prompt and interact with the interpreter directly to write your programs.
Python is Object-Oriented − Python supports Object-Oriented style or technique of programming that encapsulates code within objects.
Python is a Beginner's Language − Python is a great language for the beginner-level programmers and supports the development of a wide range of applications from simple text processing to WWW browsers to games.
Python's features include −
Easy-to-learn − Python has few keywords, simple structure, and a clearly defined syntax. This allows the student to pick up the language quickly.
Easy-to-read − Python code is more clearly defined and visible to the eyes.
Easy-to-maintain − Python's source code is fairly easy-to-maintain.
A broad standard library − Python's bulk of the library is very portable and cross-platform compatible on UNIX, Windows, and Macintosh.
Interactive Mode − Python has support for an interactive mode which allows interactive testing and debugging of snippets of code.
Portable − Python can run on a wide variety of hardware platforms and has the same interface on all platforms.
Extendable − You can add low-level modules to the Python interpreter. These modules enable programmers to add to or customize their tools to be more efficient.
Databases − Python provides interfaces to all major commercial databases.
GUI Programming − Python supports GUI applications that can be created and ported to many system calls, libraries and windows systems, such as Windows MFC, Macintosh, and the X Window system of Unix.
Scalable − Python provides a better structure and support for large programs than shell scripting.
Apart from the above-mentioned features, Python has a big list of good features, few are listed below −
It supports functional and structured programming methods as well as OOP.
It can be used as a scripting language or can be compiled to byte-code for building large applications.
It provides very high-level dynamic data types and supports dynamic type checking.
It supports automatic garbage collection.
It can be easily integrated with C, C++, COM, ActiveX, CORBA, and Java.
How to Install Jupyter Notebook on your system ?
Begin_with_Basics.ipynb
Chapter- 2 Introduction to Numpy
In this Chapter , we will learn how to use
All the Topics Covered under this Chapter are the Basic Use-cases of Numpy usage in daily usage.
Introduction to Numpy
Some basic Examples
Numpy Arrays: Creation, Methods & Attributes
Common Manipulations: indexing, slicing & reshaping
Examples: Performing a Simulation
By Learning the implementation of this use-cases we will learn and demonstrate these project by the end of course. Shown below.
Introduction_To_Numpy.ipynb
Chapter- 3 -> Data Analysis with Pandas
Now here you will Learn about: Analysis with Pandas
Introduction to Pandas (Docs)
Introducing the most important objects: Data Frames and Series.
The Pandas Series
Creating a Pandas Series
Pandas DataFrames
Main Properties , Operation and Manipulations
Reading the data
The Anatomy of Data Frame
Inspecting the Data - Selection , Addition , deletion
Slicing
Answering Simple Question about the dataset ?
HR employee Dataset
Data_Analysis_With_Pandas.ipynb
img.zip
Chapter-4 ->Introduction to SeaBorn Lib & Matplotlib
Congrats! you have Learnt a lot Now it's Time to Learn about the Seaborn
Matplotlib
The basic Concepts: figures, subplots ( axes) and axis.
Object Oriented Interface (OOI) vs pyplot
Common Customization: colors, labels , ticks, tick marks, limits and annotations
Some Commonly used visualizations in data analytics.
Introduction to Seaborn
Exploratory Data Analysis
Seaborn
What is Exploratory Data Analysis(EDA)
Doing Exploratory Data Analysis: Loading the data
Some Questions that will Guide you the Data analysis being done.
Understanding main ,Numerical ,Categorical variables.
Relationships between Numerical variables
Relationships Sales Price with Categorical variables.
Matplotlib.ipynb
Exploratory_Data_Analysis.ipynb
Introduction to SeaBorn .ipynb
img.rar
Chapter - 5 Scipy-Statistics
In this Section , we are going to learn about
Scipy-Statistics.
The Statistics Sub-package
Project: Alcohol Consumption of students
Confidence Intervals
Probability calculations
Null Hypothesis testing Framework
Some Statistical test from scipy.stats
Basic Question based on Project Alcohol Consumption of students . (BASED ON REAL USE-CASES)
Scipy-Stats.ipynb
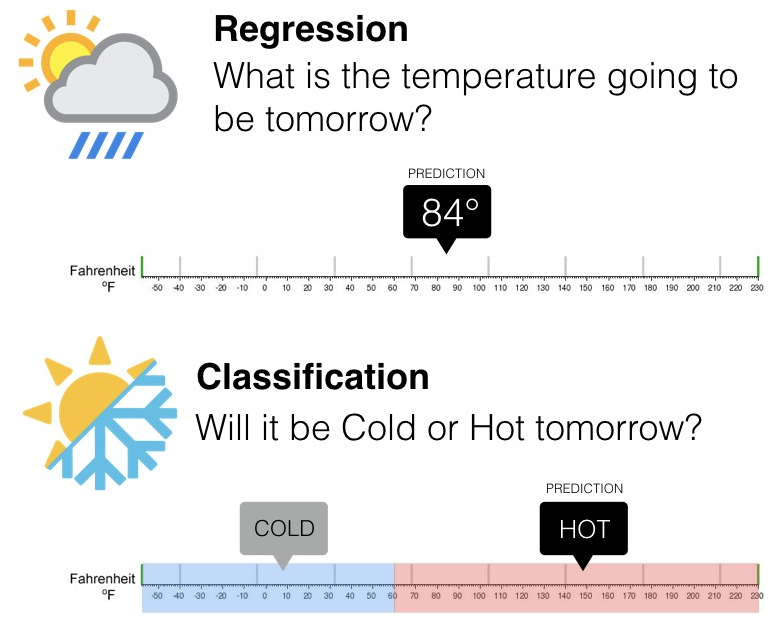
Chapter- 6 -> Classification & Regression Example
So , Far you have learnt about Numpy , pandas, scipy-stats, Matplotlib and Sea-born.
Let's get started with the final usage or you can say building the Regression & Classification Model out of it.
Analysing the House Predication Data sets :
For Regression Example:
Analyzing Neighbourhood with more than 30 Observations
Transforming Neighbourhood and CentralAir to one-hot Encoding format
Building a Linear Regression Model
Make a prediction for New house.
Analyzing Predicting the drinking habits of teenagers
What is simplest possible model ? just predict the most common category!
Building Logistic Regression Model
Model Evaluation (naively done)
Accuracy of Logistic regression
Some Complex Models examples
Analyzing the Scikit-learn with example data-sets
Getting some data
Estimators objects
Import the estimator (model)
Create an instance of the estimator
Use the data to train the estimator
Evaluate the Model
Use the data to make "Predictions"
ClassificationExample.ipynb
Scikit-learn.ipynb
RegressionExample.ipynb
₹3,749
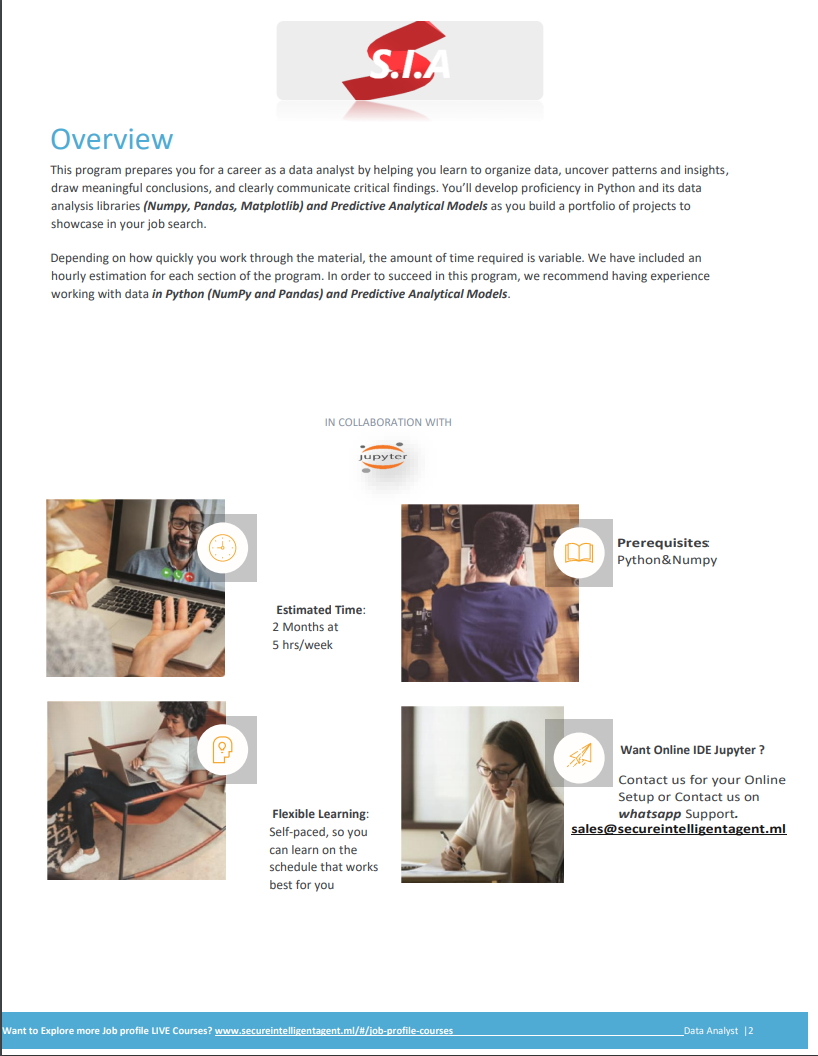
Become a Data Analyst
Use Jupyter & Learn Predictive Analytics Models & statistics to uncover insights and Create Data-Driven Solutions